Follow the Friction: How UK Companies Are Using Their Own Data to Find Hidden Revenue
Forget the next campaign. Forget the new social channel. For a growing number of UK businesses, the biggest untapped revenue opportunity isn't something they need to go out and find — it's something they've been generating data about for years without ever properly looking at it.
Conversion optimisation used to be the domain of large e-commerce operations with dedicated analytics teams and six-figure testing budgets. Not any more. The tools have become accessible, the methodologies have matured, and UK SMEs are increasingly discovering that a rigorous look at their own data can unlock revenue that was effectively invisible.
The approach has a useful name: conversion archaeology. Dig into the layers of user behaviour data already sitting in your analytics platform, and you'll often find the fossils of lost sales — the exact moments where customers encountered friction and quietly walked away.
Why Most Businesses Are Sitting on Untapped Potential
Here's a number worth sitting with: the average e-commerce conversion rate in the UK hovers around 2-3%. That means for every 100 people who visit a typical online shop, 97 or 98 leave without buying anything.
Some of that is inevitable — people browse, compare, and return later. But a meaningful proportion of that lost traffic represents genuine purchase intent that got derailed somewhere along the journey. A confusing navigation. A form that asked for too much information. A checkout that didn't offer a preferred payment method. A page that loaded slowly on a mid-range Android handset.
These are fixable problems. The challenge is identifying exactly where they're happening — and that's where the data comes in.
The Conversion Audit Framework
A proper conversion audit isn't about guessing where users are struggling. It's about building a systematic picture from multiple data sources, each of which illuminates a different aspect of user behaviour.
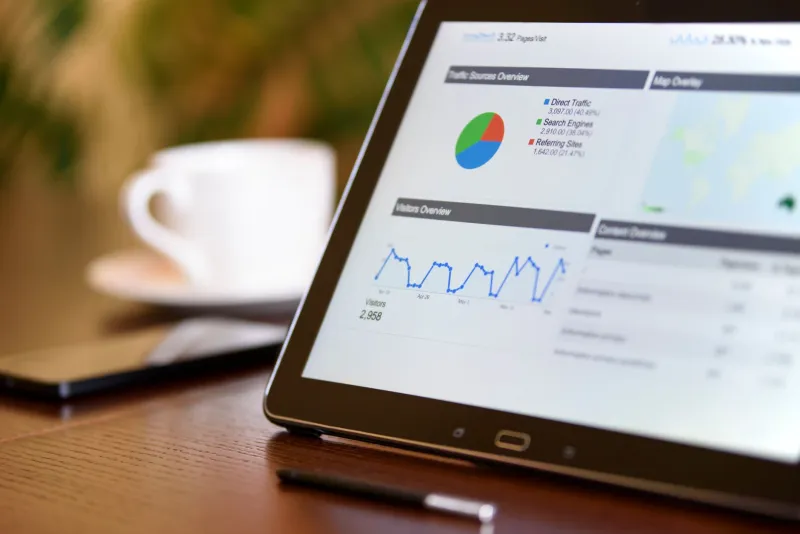
Start with your analytics funnel. Google Analytics 4, or whichever platform you're using, will show you where users are dropping out of key journeys. A checkout funnel report, for example, might reveal that 60% of users who add an item to their basket abandon at the delivery options page. That's not a guess — that's a specific problem at a specific point, and it narrows the investigation considerably.
Layer in heat mapping. Tools like Hotjar, Microsoft Clarity (which is free), or Crazy Egg generate visual maps of where users click, scroll, and hover on any given page. Heat maps routinely surface things that analytics can't: the button users are clicking that doesn't do anything, the section of the page that nobody scrolls to, the image users keep clicking on that isn't actually a link.
Watch session recordings. This is where conversion archaeology gets genuinely revelatory. Session recordings capture real user journeys — not aggregated data, but individual people navigating your website in real time. Watching a user encounter a form field that won't accept their postcode format, or struggle to find the phone number they're looking for, is a fundamentally different experience from reading a bounce rate statistic. It makes the problem visceral.
Survey the people who left. Exit-intent surveys — those small pop-ups that appear when a user moves their cursor toward the browser tab — can capture qualitative data that no analytics tool can provide. 'What stopped you completing your purchase today?' is a simple question that regularly produces answers that reshape entire product strategies.
Real Results From Real UK Businesses
A Manchester-based B2B software company recently ran their first proper conversion audit after noticing that trial sign-up rates had plateaued despite healthy traffic growth. Their analytics funnel showed a significant drop-off on the sign-up form itself — which seemed strange, given that the form had only four fields.
Session recordings told the story. Users were filling in the first three fields, hitting the company name field, and abandoning. The field had an autocomplete function that was suggesting incorrect companies, confusing users and undermining trust at a critical moment. A two-hour fix — removing the autocomplete — produced a 34% uplift in completed sign-ups within three weeks.
The revenue impact was immediate and significant. The fix cost almost nothing. The insight was sitting in their data the whole time.
A Yorkshire-based independent retailer discovered through heat mapping that their mobile product pages had a 'phantom click' problem. Users were repeatedly tapping on product images expecting to see a larger view — a behaviour so standard on mobile that users assumed it would work. It didn't. Adding a simple image zoom function increased mobile add-to-basket rates by 22%.
Neither of these businesses needed expensive consultants or complex technology. They needed to look at what their users were actually doing.
Where to Start Your Own Dig
If you haven't run a conversion audit before, the volume of potential data can feel overwhelming. The key is to narrow the scope before you start.
Pick one journey. Don't try to audit your entire website at once. Choose the single most commercially important journey — typically your primary checkout or lead generation flow — and focus your initial audit entirely on that.
Define your baseline. Before you change anything, document your current conversion rates at each stage of the funnel. You need a before figure to measure improvement against. This sounds obvious, but it's surprisingly often skipped.
Form a hypothesis before you test. When you spot an anomaly in the data — a page with an unusually high exit rate, a form field with high abandonment — resist the urge to immediately change it. Form a hypothesis about why users are struggling, then design a change that specifically tests that hypothesis. This discipline makes your findings far more useful over time.
Test one thing at a time. The temptation to fix everything at once is understandable, but it makes it impossible to know what actually worked. Isolate changes where you can.
Set a review cadence. Conversion optimisation isn't a one-off project. The businesses getting the most from their data treat it as a continuous process — a monthly or quarterly audit cycle that keeps compounding improvements over time.
The Competitive Advantage Nobody's Talking About
Here's the thing about conversion archaeology: most of your competitors aren't doing it. They're spending money on driving more traffic to journeys that are fundamentally broken, hoping volume will compensate for friction.
The businesses that are winning — quietly, consistently, without necessarily spending more on marketing — are the ones that have stopped asking 'how do we get more visitors?' and started asking 'what's stopping the visitors we already have from converting?'
The data to answer that question is already sitting in your analytics platform. You just have to be willing to dig.